Scripting FSLeyes - a tutorial
FSLeyes is a highly versatile software to display neuroimaging data. For many research questions a spatial map, such as the statistical map from a functional localizer, represents the actual main result (see a previous blog post for an example). This is why great care should be taken to ensure that the display is accurate and reproducible. Manual adjustment of the settings and clicking in the GUI, however, is cumbersom and errorprone. Especially in cases, when different subject groups or species are compared, it is important to have a flexible display with adaptive settings, that produces comparable results. The FSLeyes Python API allows the user to script the display and to interact with it interactively. For example, FSLeyes can be launched together with a Jupyter notebook. In a previous blog post I showed how this feature can be used to manually define colourmaps.
For a lab retreat I wrote a tutorial on how to script FSLeyes using a Jupyter notebook. The tutorial is available in my GitHub repository »> HERE «<.
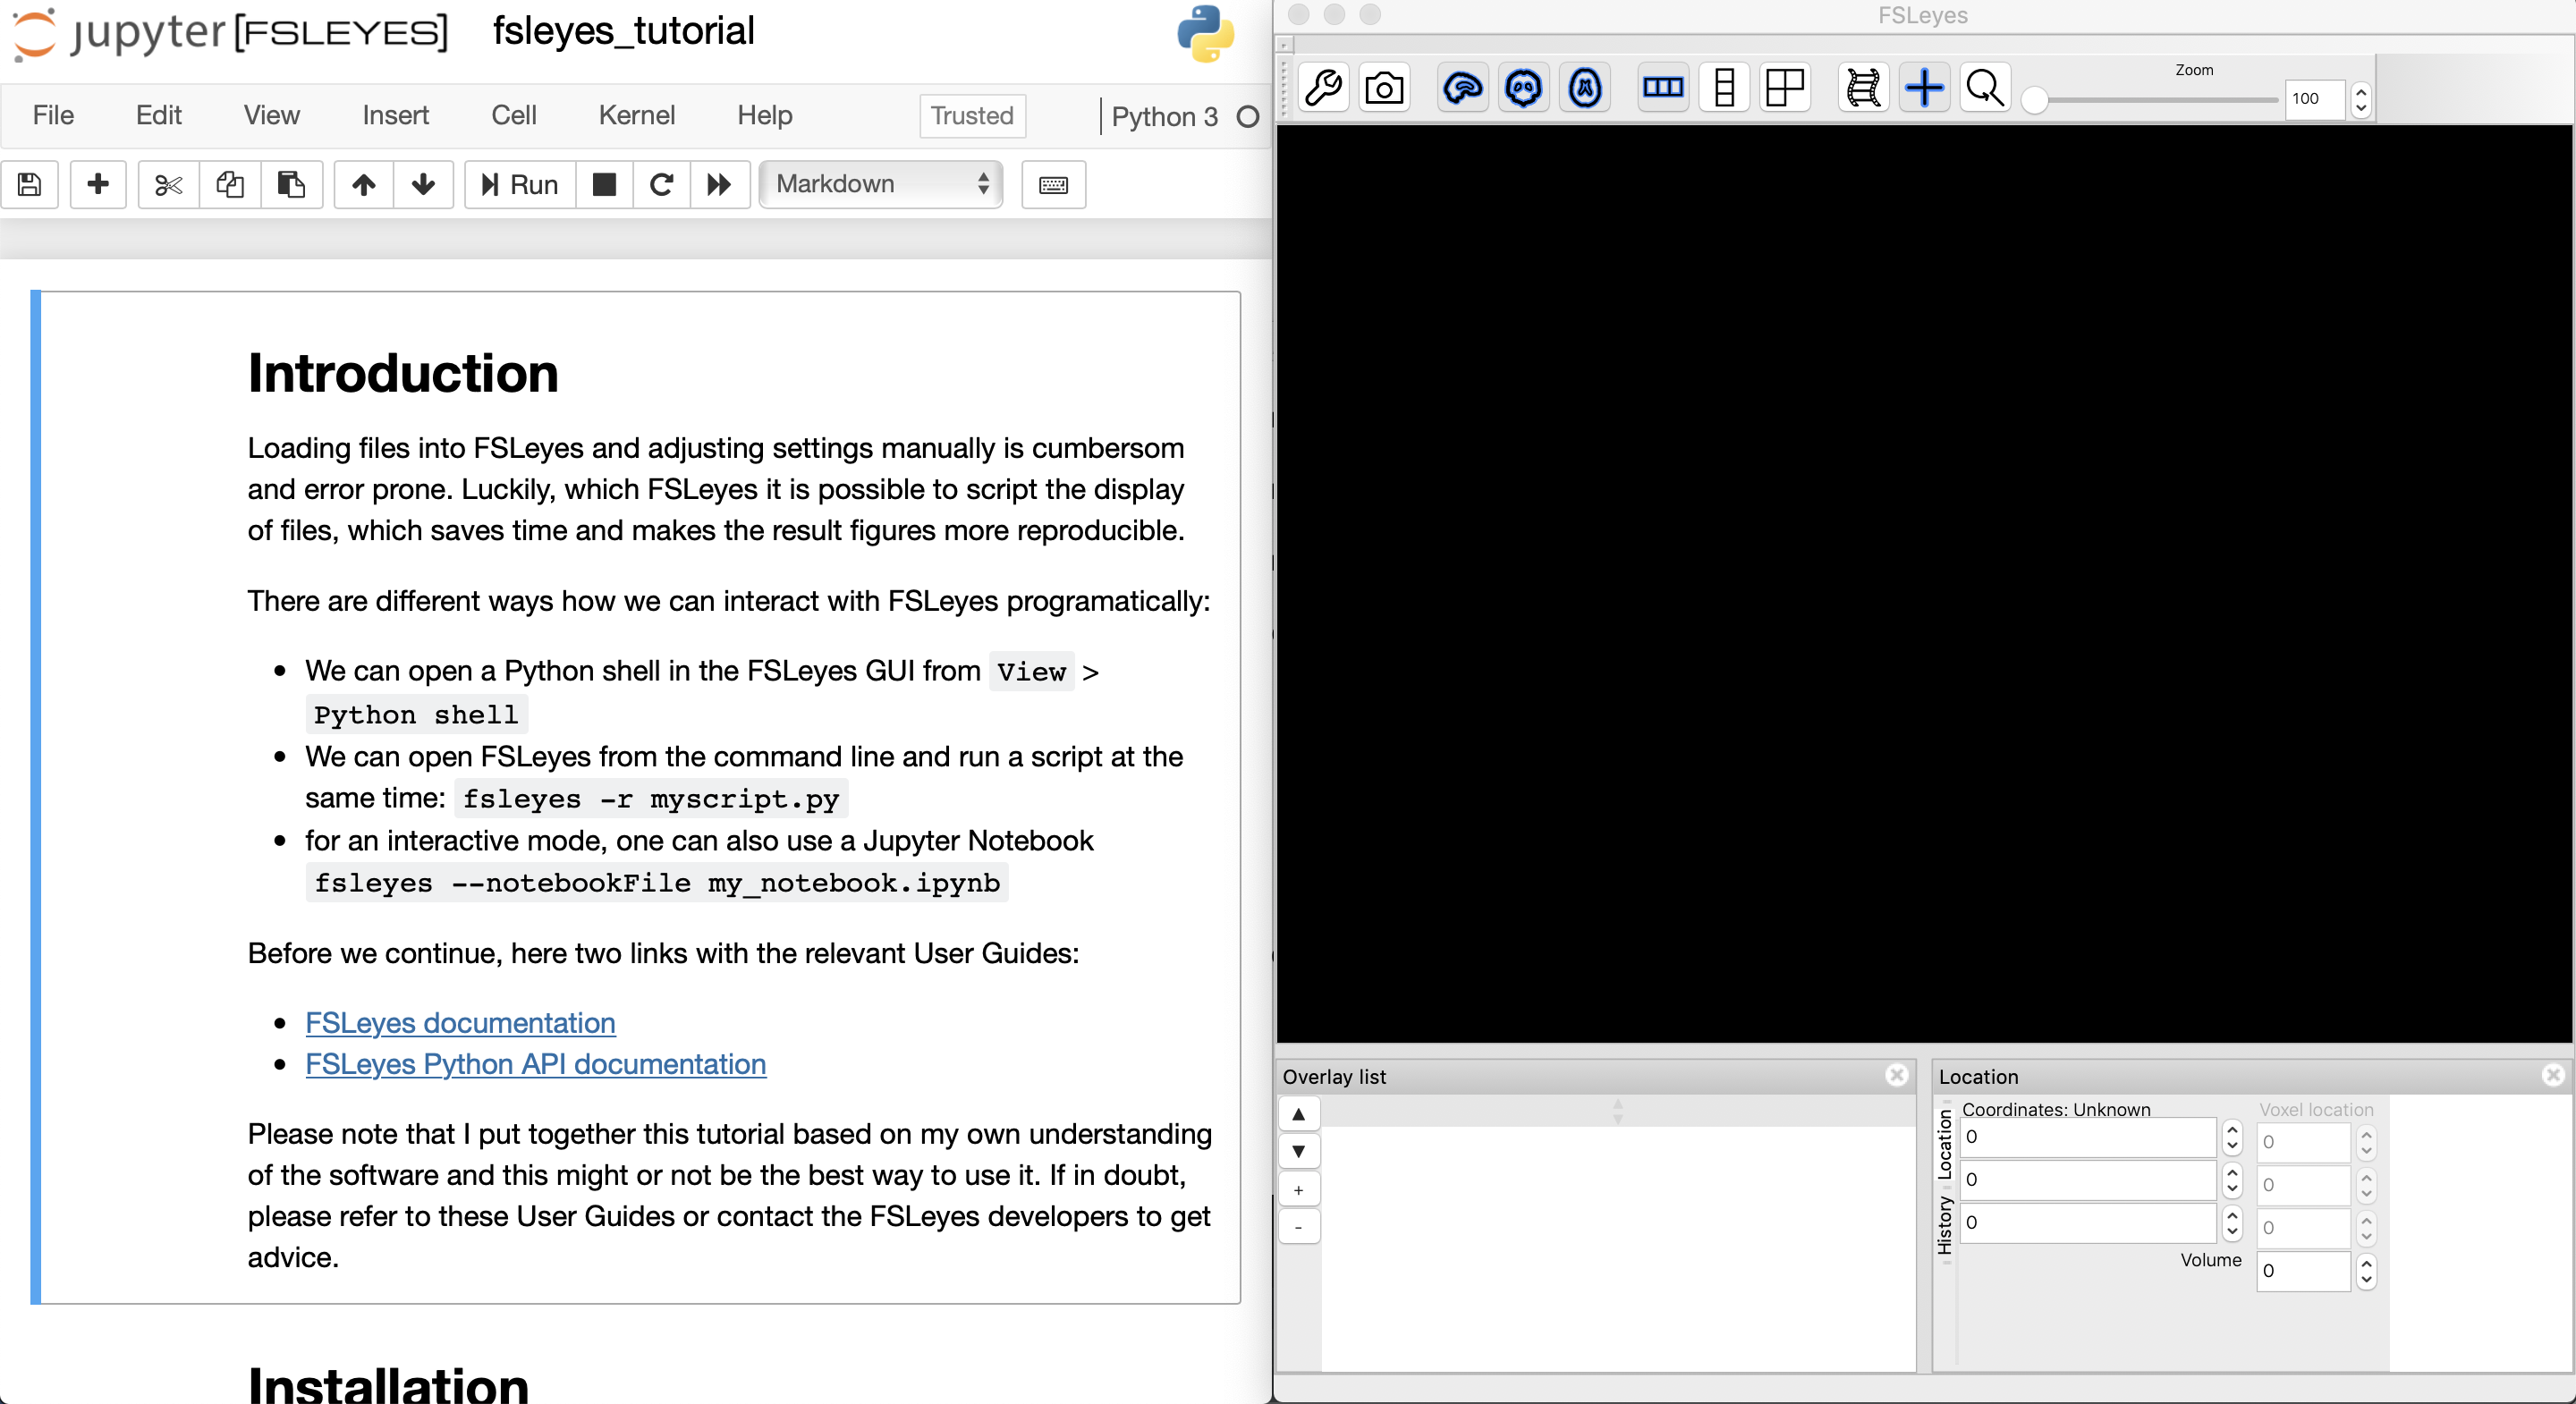
When FSLeyes is launched from the terminal with the --notebookFile flag (fsleyes --notebookFile mynotebook.ipynb) both the FSLeyes GUI and a browser are launched together:
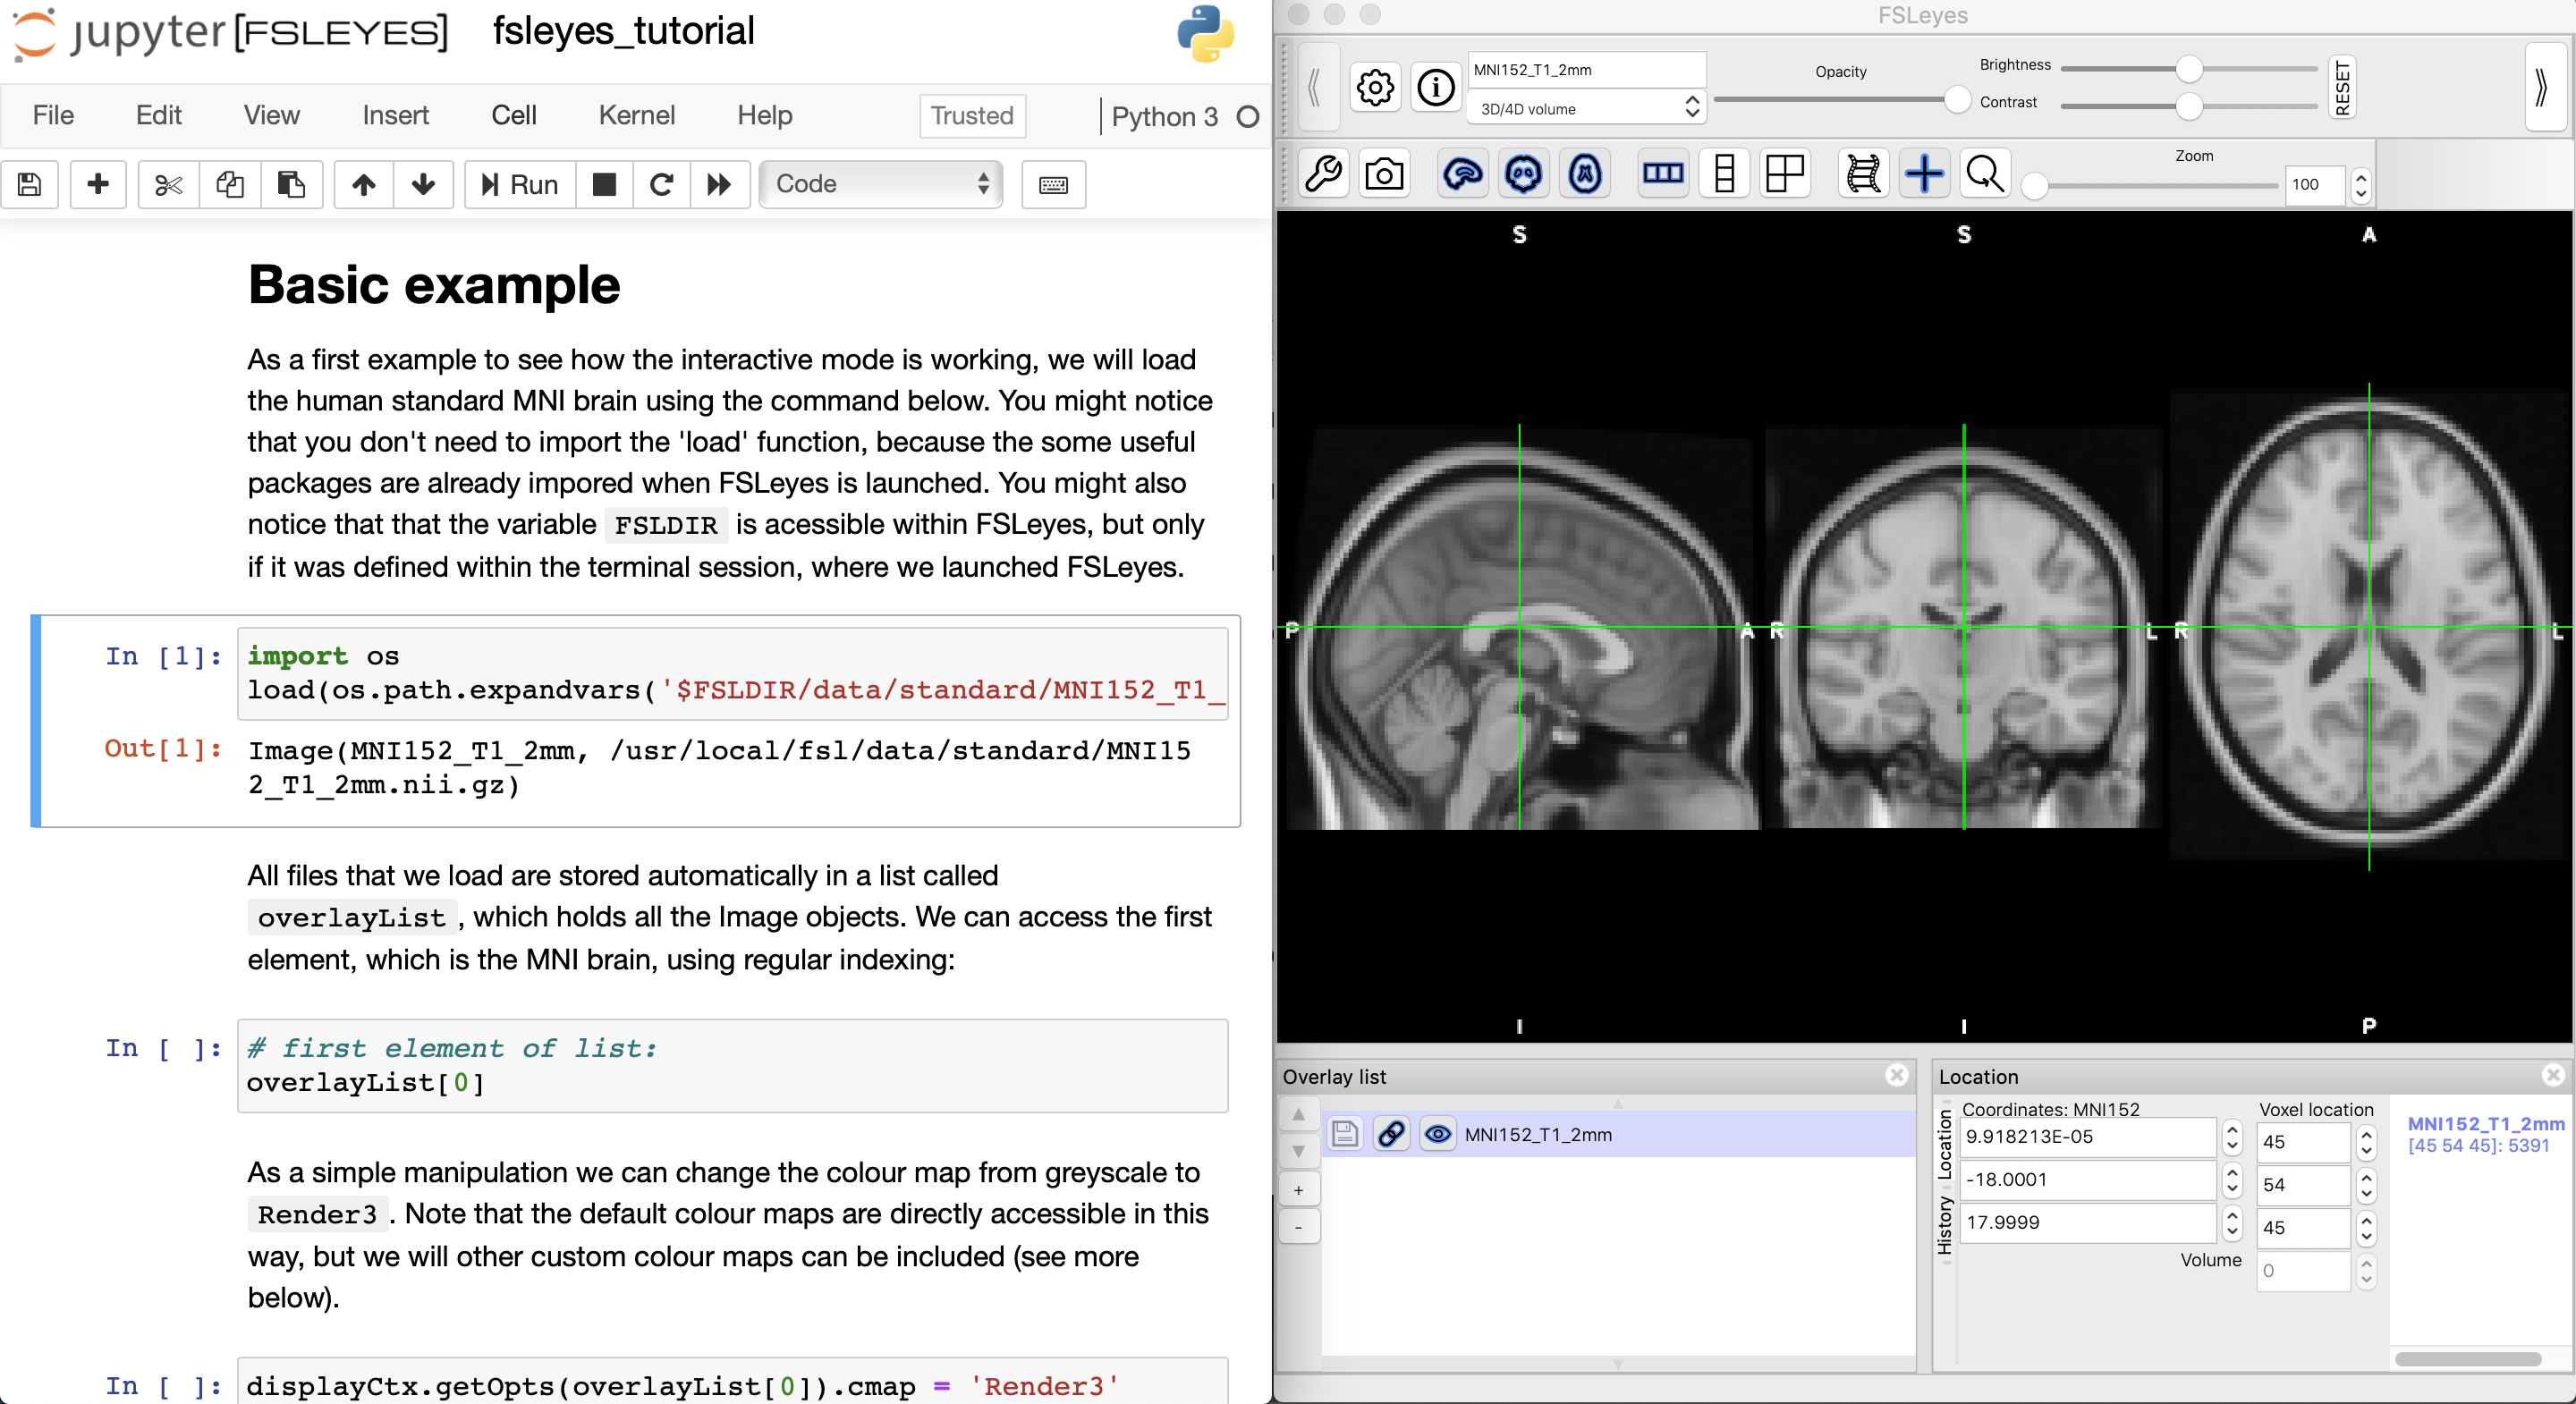
When cells within the notebook are executed, the FSLeyes display is automatically updated. In the example below, we loaded the standard MNI brain.
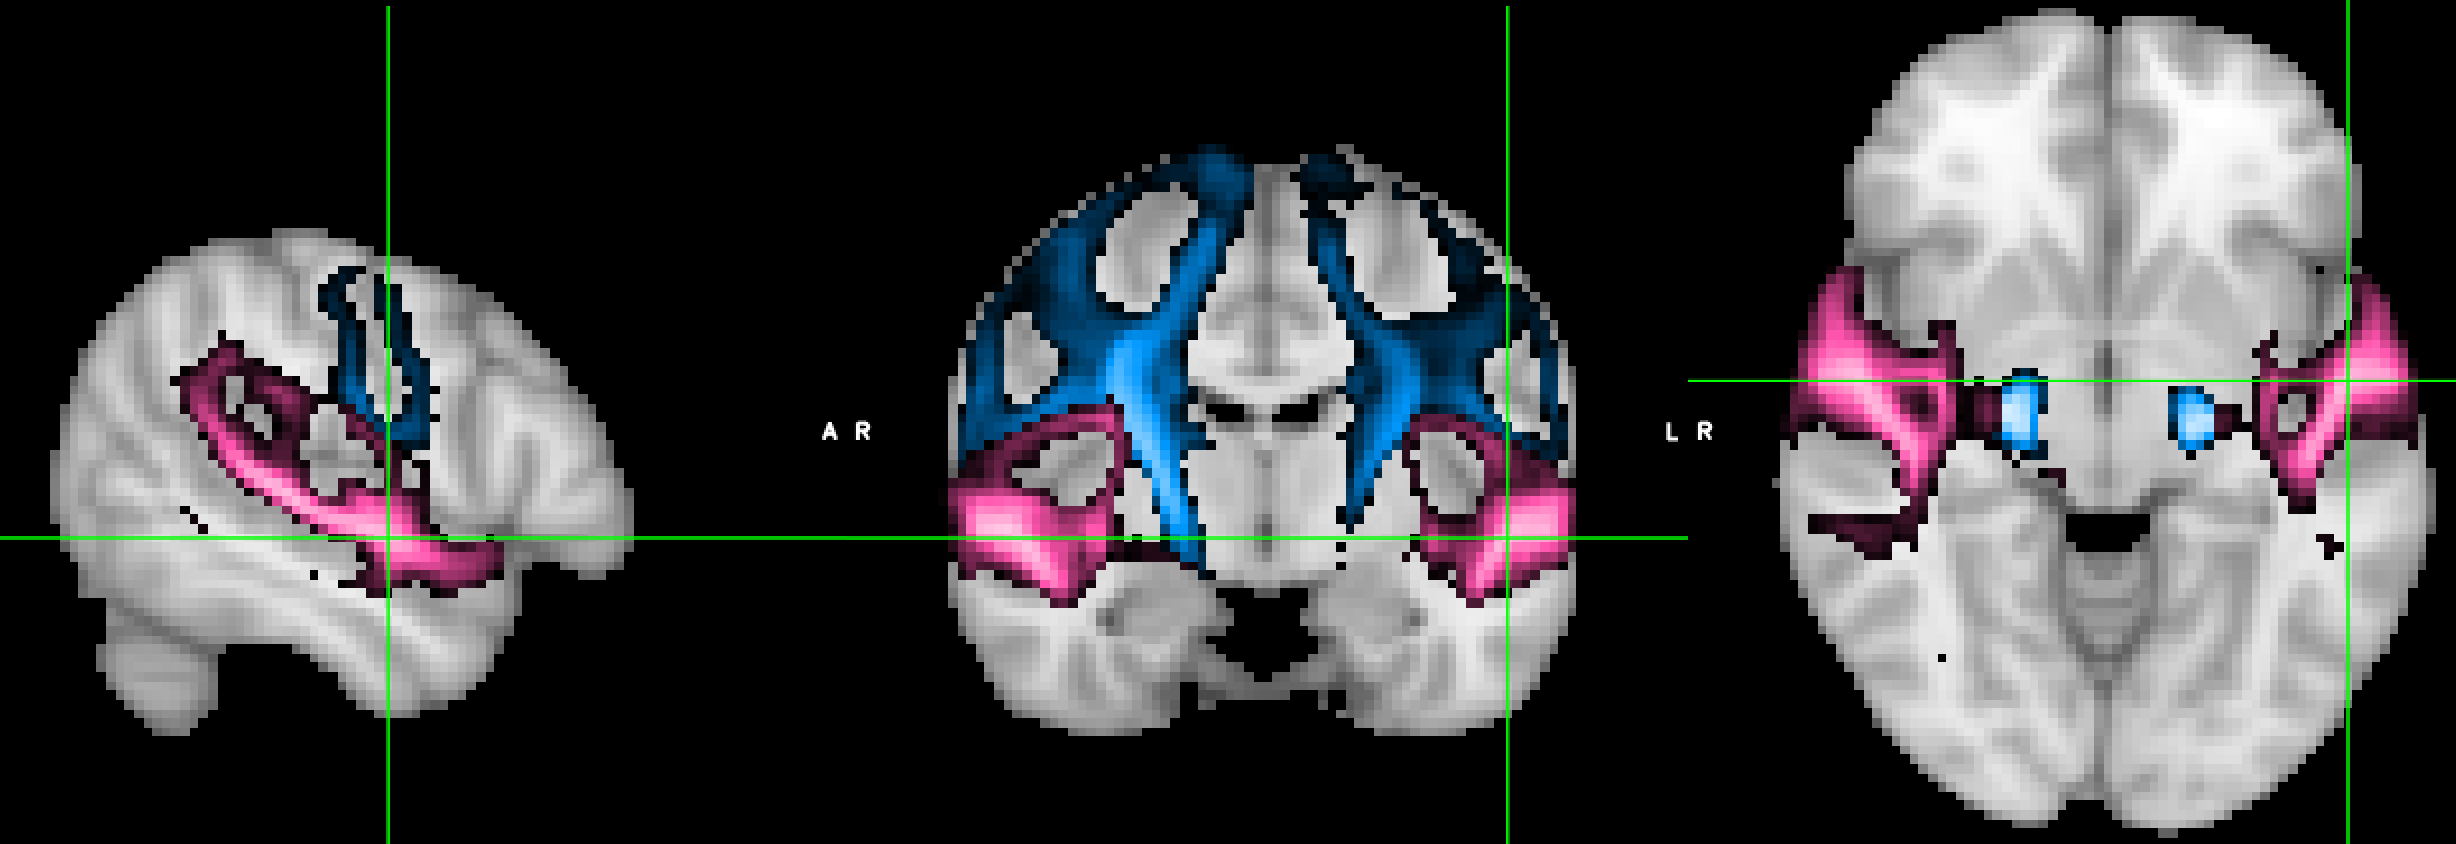
The tutorial takes the user through a script, which shows a structural brain scan together with the tractography results for two maior fiber tracts in the brain. The thresholds and colours of the tractograms are programatically determined and the cursor is automatically placed on the voxel of highest intensity for one of the tracts.
The script contains a variable study_group, which could be changed from control to patients, for example. Depending on this variable, different files are loaded and different settings are chosen.
The same display can also be created directly by launching FSLeyes with the --runscript flag (fsleyes --runscript myscript.py).
The Python API has the advantage that the display script can be combined with some basic processing and analysis steps using Python packages, such as nibabel and nilearn.
That’s it!
As the tutorial data is not openly available, the online tutorial notebook will not run. I hope, however, that the code snippets will give you some inspiration about how this will be useful for your own analysis or for teaching purposes, so please have a look at it!
Thanks for reading this post :-)
Nicole